Saturday, 26 May 2018

Flexible Budgets

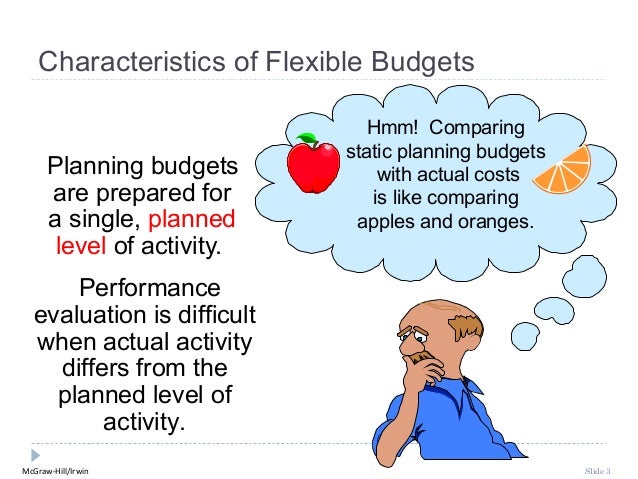
Characteristics of Flexible Budgets                               Hmm! Comparing                            static plannin...
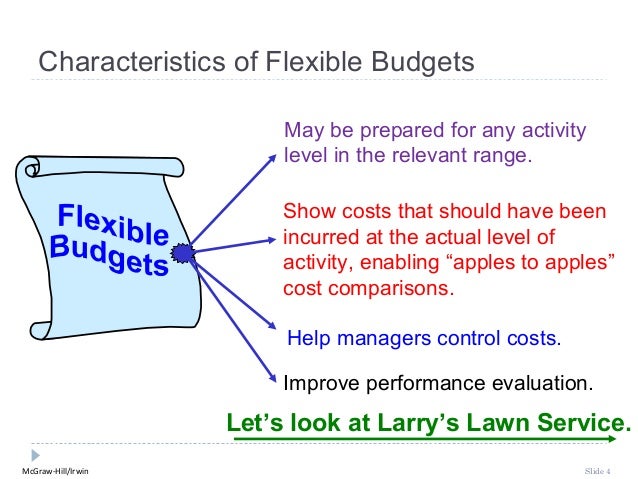
Characteristics of Flexible Budgets                         May be prepared for any activity                         level...
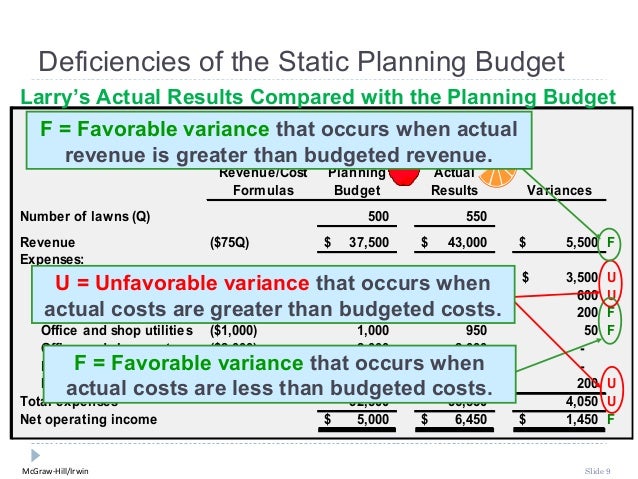
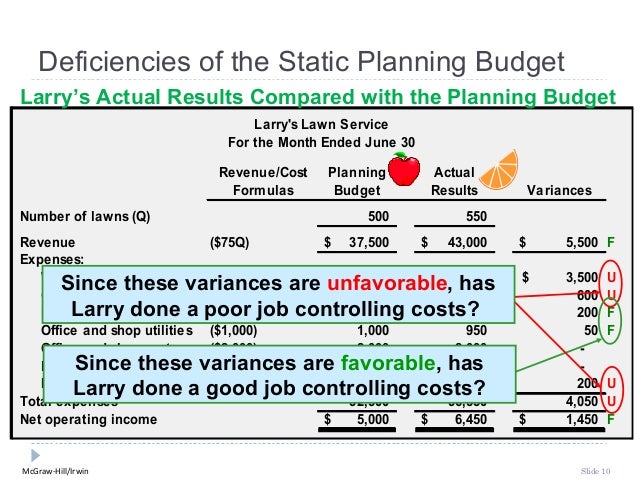
Deficiencies of the Static Planning Budget      Larry’s Lawn Service provides lawn care in a planned      Larry’s Lawn Ser...
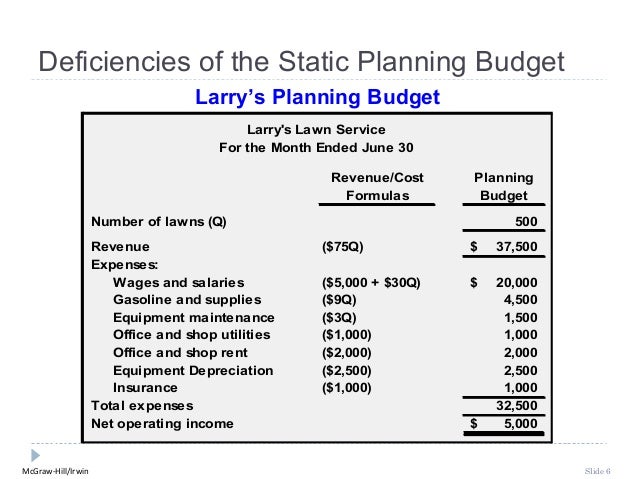
Deficiencies of the Static Planning Budget                                   Larry’s Planning Budget                      ...

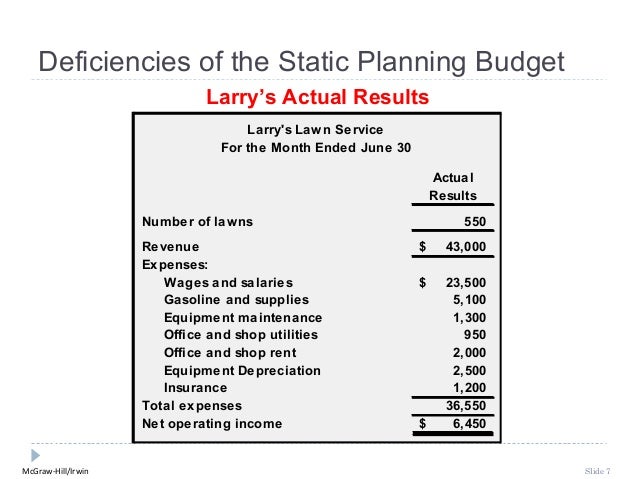
Deficiencies of the Static Planning Budget                             Larry’s Actual Results                             ...
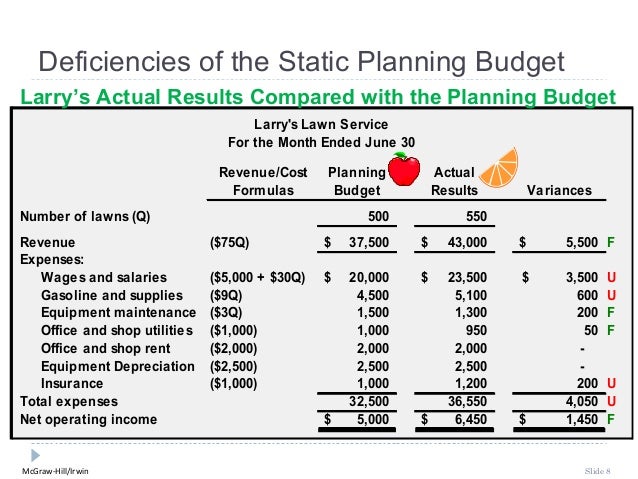
Deficiencies of the Static Planning BudgetLarry’s Actual Results Compared with the Planning Budget                        ...
Deficiencies of the Static Planning BudgetLarry’s Actual Results Compared with the Planning Budget  F = Favorable variance...
Deficiencies of the Static Planning BudgetLarry’s Actual Results Compared with the Planning Budget                        ...
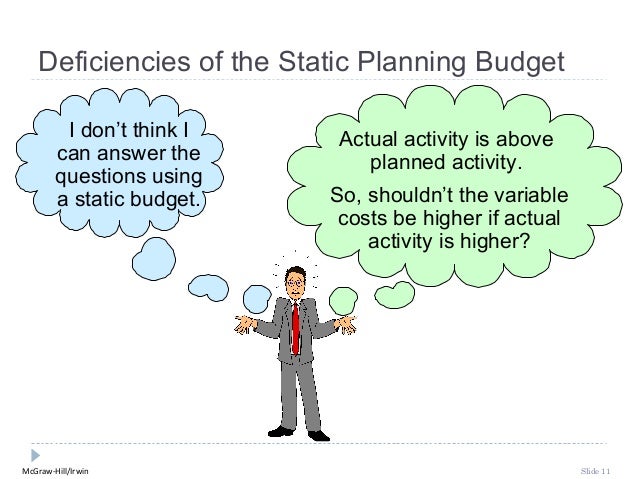
Deficiencies of the Static Planning Budget         I don’t think I   Actual activity is above        can answer the       ...
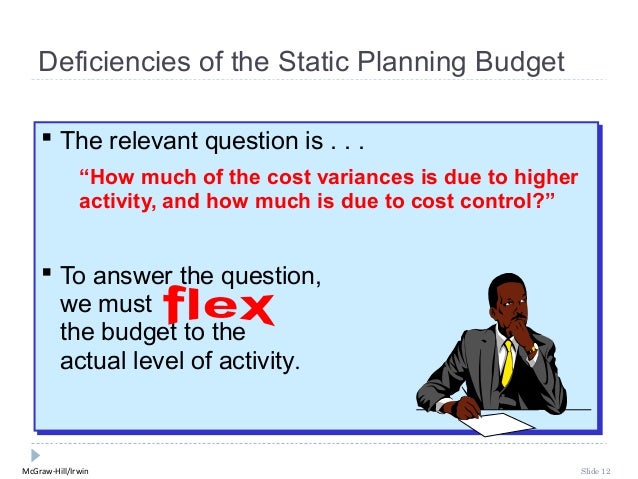
Deficiencies of the Static Planning Budget     The relevant question is .. .. ..     The relevant question is           ...
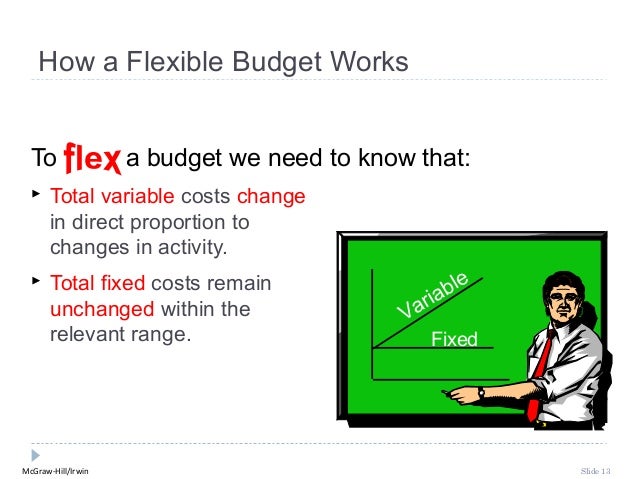
How a Flexible Budget Works  To                a budget we need to know that:      Total variable costs change       in d...
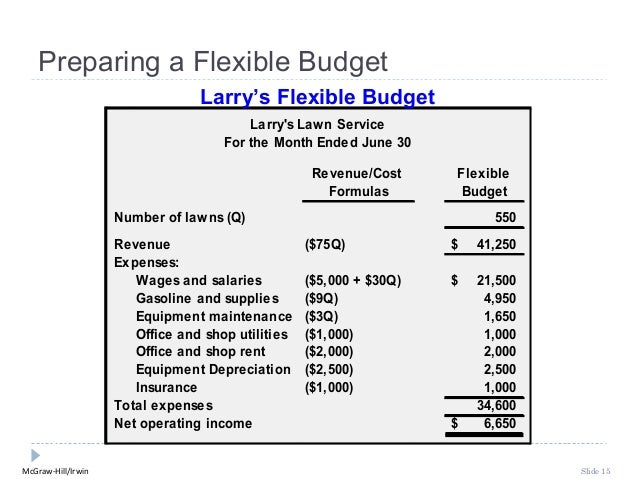
How a Flexible Budget Works                     Let’s prepare a                             budget                    for ...
Preparing a Flexible Budget                                 Larry’s Flexible Budget                                       ...

Vertical Analysis

Vertical Analysis Overview
Vertical analysis is the proportional analysis of a financial statement, where each line item on a financial statement is listed as a percentage of another item. Typically, this means that every line item on an income statement is stated as a percentage of gross sales, while every line item on a balance sheet is stated as a percentage of total assets.
The most common use of vertical analysis is within a financial statement for a single time period, so that one can see the relative proportions of account balances. Vertical analysis is also useful for timeline analysis, to see relative changes in accounts over time, such as on a comparative basis over a five-year period. For example, if the cost of goods sold has a history of being 40% of sales in each of the past four years, then a new percentage of 48% would be a cause for alarm.
Vertical Analysis of the Income Statement
The most common use of vertical analysis in an income statement is to show the various expense line items as a percentage of sales, though it can also be used to show the percentage of different revenue line items that make up total sales.  An example of vertical analysis for an income statement is shown in the far right column of the following condensed income statement:

Rs. Totals
Percent
Sales
Rs.1,000,000
100%
Cost of goods sold
400,000
40%
Gross margin
600,000
60%


Salaries and wages
250,000
25%
Office rent
50,000
5%
Supplies
10,000
1%
Utilities
20,000
2%
Other expenses
90,000
9%
Total expenses
420,000
42%
Net profit
180,000
18%
The information provided by this income statement format is useful not only for spotting spikes in expenses, but also for determining which expenses are so small that they may not be worthy of much management attention.
Vertical Analysis of the Balance Sheet
The central issue when creating a vertical analysis of a balance sheet is what to use as the denominator in the percentage calculation. The usual denominator is the asset total, but one can also use the total of all liabilities when calculating all liability line item percentages, and the total of all equity accounts when calculating all equity line item percentages. An example of vertical analysis for a balance sheet is shown in the far right column of the following condensed balance sheet:

Rs. Totals
Percent
Cash
Rs.100,000
10%
Accounts receivable
350,000
35%
Inventory
150,000
15%
     Total current assets
600,000
60%


Fixed assets
400,000
40%
Total assets
Rs.1,000,000
100%


Accounts payable
Rs.180,000
18%
Accrued liabilities
70,000
7%
     Total current liabilities
250,000
25%


Notes payable
300,000
30%
     Total liabilities
550,000
55%


Capital stock
200,000
20%
Retained earnings
250,000
25%
     Total equity
450,000
45%
Total liabilities and equity
Rs.1,000,000
100%
The information provided by this balance sheet format is useful for noting changes in a company's investment in working capital and fixed assets over time, which may indicate an altered business model that requires a different amount of ongoing funding.


Thursday, 24 May 2018

Horizontal or trend analysis of financial statements

Horizontal analysis (also known as trend analysis) is a financial statement analysis technique that shows changes in the amounts of corresponding financial statement items over a period of time. It is a useful tool to evaluate the trend situations.
The statements for two or more periods are used in horizontal analysis. The earliest period is usually used as the base period and the items on the statements for all later periods are compared with items on the statements of the base period. The changes are generally shown both in dollars and percentage.
Dollar and percentage changes are computed by using the following formulas:
Horizontal analysis may be conducted for balance sheet, income statement, schedules of current and fixed assets and statement of retained earnings.

Example:

An example of the horizontal analysis of balance sheet, schedule of current assets , income statement and statement of retained earnings is given below:

Comparative balance sheet with horizontal analysis:

Comparative schedule of current assets:

Comparative income statement with horizontal analysis:

Comparative retained earnings statement with horizontal analysis:

In above analysis, 2007 is the base year and 2008 is the comparison year. All items on the balance sheet and income statement for the year 2008 have been compared with the items of balance sheet and income statement for the year 2007.


The actual changes in items are compared with the expected changes. For example, if management expects a 30% increase in sales revenue but actual increase is only 10%, it needs to be investigated.

Wednesday, 23 May 2018

PUBLIC SERVICE MESSAGE


.
کراچی میں ہیٹ سٹروک کی وجہ سے کئی افراد افراد جاں بحق ہوگئے ہیں، ہم نہایت عجلت کے ساتھ بدلتی ہوئی موسمیاتی تبدیلیوں سے بالکل بے خبر ہیں، یہ انتہائی تشویشناک غفلت ہے، خدا کیلئے کراچی کے دوست انہی دنوں میں درخت لگانے کی مہم چلائیں، یوں تو درختوں کی ضرورت پورے پاکستان بلکہ پوری دنیا کو ہے، لیکن کراچی کی گرمی کا اس سے بہتر کوئی حل نہیں، جو اس گرمی سے موت کے منہ میں چلے گئے، اللہ تعالیٰ اُن کی بخشش فرمائے، لیکن جو جیتے جی گرمی سے دم گھٹ گھٹ کر جل مررہے ہیں، خدارا اپنی جان، اپنی نسلوں اور اپنے خطے پر رحم کریں، 50 روپے سے لے کر 200 روپے کا ایک درخت ہے، فی بندہ نہ سہی، فی گھر ایک درخت لگانے کی ذمہ داری لی جائے تو آپ دیکھیں گے کہ صرف ایک سے ڈیڑھ سال میں حیرت انگیز نتائج سامنے ہوں گے، حکومتوں سے توقع لگانا عبث ہے، خود ہی آگے بڑھیئے، اور اپنی ذمہ داری نبھائیے۔ 
Image may contain: outdoor and text

No automatic alt text available.


اسٹاربکس کافی کی شکایت پرلاہورکے ریسٹورنٹ کونوٹس

فرنچائزہولڈرنہیں،مسابقتی کمیشن میں آپشنز کا اعتراف، الزام بھی ثابت،پیش ہونے کاحکم
۔فوٹو: فائل

 مسابقتی کمیشن آف پاکستان(سی سی پی) نے آپشن انٹرنیشنل کو بادی النظر میں دھوکا دھی سے اسٹاربکس کافی کی فروخت اور کمپیٹیشن ایکٹ کے سیکشن 10 کی خلاف ورزی پر شو کازنوٹس جاری کر دیا ہے۔

اس ضمن میں سی سی پی کی جانب سے جاری کردہ اعلامیے میں بتایا گیا ہے کہ امریکی ریاست واشنگٹنمیں رجسٹرڈانٹرنیشنل کافی چین اسٹاربکس نے لاہور کے مقامی ریسٹورنٹ آپشنز کافی اینڈمورکے خلاف سی سی پی کو شکایت کی کہ وہ دھوکا دہی سے اس کے آفیشل ٹریڈ مارک ’’اسٹاربکس کافی‘‘ کا استعمال کر کے صارفین کو گمراہ کرنے کے ساتھ ساتھ اس کے کاروباری مفادات کو نقصان پہنچا رہا ہے۔
اسٹاربکس نے کہا کہ اس کی پاکستان میں کوئی بھی فرنچائز نہیں، سی سی پی کی بنائی گئی انکوائری کمیٹی کی رپورٹ کے مطابق آپشن نہ صرف اپنے کیفے کے مرکزی سائن بورڈ پر بلکہ اپنے پیکیجنگ میٹیریل، مگس، مینیوز،ویب سائٹ اور فیس بک پیج پر بھی اسٹاربکس کے ٹریڈ مارک کا استعمال کر رہا تھا، آپشن یہ دعویٰ بھی کر رہا تھا کہ وہ اسٹاربکس مشینوں میں تیارکردہ اصل اسٹاربکس کافی صارفین کے لیے پیش کررہاہے۔
انکوائری رپورٹ کے مطابق مندرجہ بالا جھوٹے دعوے کر کے اور صارفین کو گمراہ کر کے آپشن انٹرنیشنل بادی النظر میں کمپیٹیشن ایکٹ کے سیکشن 10کی خلاف ورزی کرنے اور اسٹاربکس کے کاروباری مفادات کو نقصان پہنچانے کا باعث بنا ہے، آپشن انٹرنیشنل نے خود بھی تسلیم کیا ہے کہ اگرچہ وہاسٹاربکس کافی فروخت کر رہا ہے لیکن وہ اسٹاربکس انٹرنیشنل کا فرنچائز ہولڈر نہیں ہے۔
انکوائری رپورٹ کے مطابق کسی معاہدے کے بغیر آپشن انٹرنیشنل کو ایسا کوئی حق حاصل نہیں کہ وہ اسٹاربکس کافی فروخت کرے اور ایسے دعوے کرے اس لیے سی سی پی نے آپشن انٹرنیشنل کو شو کاز نوٹس جاری کرتے ہوئے  14دن کے اندر کمیشن کے سامنے پیش ہونے کی ہدایت کردی ہے۔

Ratio Analysis Part 1

RATIO ANALYSIS Ratio analysis is the process of determining and interpreting numerical relationship based on financial sta...
Basis Of Comparision Comparison with standards or industry average Interfirm Comparison involves comparing the ratios of a...
Ways To Interpret Accounting Ratios <ul><li>Single absolute ratio. </li></ul><ul><li>Group ratio. </li></ul><ul><li>Histor...
Classification Of Ratios <ul><li>Analysis of Short Term Financial Position or Test of Liquidity. </li></ul><ul><li>Analysi...
I. Test Of Liquidity <ul><li>The liquidity ratios are used to test the short term solvency or liquidity position of the bu...
Important Ratios In Test Of Liquidity <ul><li>Current ratio. </li></ul><ul><li>Quick ratio. </li></ul><ul><li>Absolute liq...
Current Ratio Ideal ratio:  2:1 High ratio indicates under trading and over capitalization. Low ratio indicates over tradi...
Quick Ratio or Acid Test Ratio Ideal ratio : 1:1 Usually, a high acid test ratio is an indication that the firm is liquid ...
Absolute Liquidity Ratio Ideal ratio : 1:2 It means that if the ratio is 1:2 or more than this the concern can be taken as...

Tuesday, 22 May 2018

MARKETING CHANNELS


Image result for marketing channels
A marketing channel is the people, organizations, and activities necessary to transfer the ownership of goods from the point of production to the point of consumption. It is the way products and services get to the end-user, the consumer; and is also known as a distribution channel.
Understanding how Marketing Channel Members add Value to Marketing Process
There are two forms of marketing channels, direct and indirect. Direct channels sell products directly to consumers and have no intermediary levels. Indirect channels sell their products through intermediary levels and do not deal with consumers.
Channel members consists of retailers and distributors. They purchase manufactured goods in bulk, and offer them to consumers in broad varieties. As a result, consumers are able to purchase small assortments of products that are produced in large quantities. An example of this, is when we purchase toothpaste. Manufactures produce thousands of pounds of toothpaste, which they provide to retail stores. Retail stores make single tubes available for purchase because consumers only desire a small quantity of the specific product at a time. Below is a graphic of the products and the process to the consumer.

Channel members perform many functions that add value to consumers. These functions are:
§  Gather Information and Distribute it
§  Develop Persuasive Communications on Offerings
§  Communicate with Buyers
§  Shape Offers to Meet Consumer Needs
§  Negotiate Prices
They also perform functions to assist transactions:
§  Physical Distribution
§  Financing
§  Risk Taking
(Kotler)
Channels members make good available to markets that desire the products by assisting companies who cannot do so on their own. Having channel members perform the functions stated above, consumers are able to purchase products in the desired quantities at a price they are willing to pay.
Channel Levels – Consumer and industrial marketing channels
Channel levels consist of consumer marketing channels or the industrial marketing channels. A factor common among both channel levels is that both include the producer as well as the end customer.

1) Zero Level channel / Direct Marketing Channel

Consists of a manufacturer directly selling to the end consumer. This might mean door to door sales, direct mails or telemarketing. Dell online sales is a perfect example of a zero level channel marketing

2) One Level channel

As the name suggests, the one level channel has an intermediary in between the producer and the consumer. An example of this can be insurance in which there is an insurance agent between the insurance company and the customer. Even E-commerce is an excellent one channel level example – wherein the companies tie up directly with E-commerce portals and then sell in the market.

3) Two level Channel

Two level channel involves the movement of goods from the company to an intermediary, from from the intermediary to another and then to customer. This is also commonly known as “breaking the bulk” in FMCG market. A widely used two level marketing channel especially in the FMCG and the consumer durables industry which consists of a wholesaler and a retailer. So the goods go from company to distributor, distributor to retailer and retailer to consumer.

4) Three level channel

Again observed in both the FMCG and the consumer durables industry, the three level channel can combine the roles of a distributor on top of a dealer and a retailer. The distributor stocks the most and spreads it to dealers who in turn give it to retailers.
In the three level channel, the example can be taken of Ice cream market. Because of the manufacturing levels required, Ice cream markets have C&F agents who stock the ice cream in refrigerated cold rooms. These ice creams are then transported to local distributors who also have refrigerated cold rooms. The distributors then transport to local dealers who will have 10-12 small freezers. And finally it is transported to the retailer who will have 1-2 freezer of each company.
Here are perfect representations for channel levels between consumer marketing channel and an industrial marketing channel.


4 Types of Audit Report

There are four types of  Audit Report . They are— Clean Report Qualified Report Disclaimer Negative Report They are briefly explai...